TL;DR - public cloud VM packaging is not indicative of performance, don’t believe what the VM T-Shirt size says, especially while comparing similarly packaged VMs from other cloud providers. Single vCPU VMs spun up on multiple clouds showed remarkable performance differences. The performance-to-cost ratio differences between the VMs were even more profound.
Go directly to the test comparisons section between VMs: Test results
The Big Picture
The public cloud erases the complexity of running a data-center for its users. A VM simply comes at a fixed hourly cost that includes the cost of all the infrastructure supporting the VM. One would think that the intense competition between public cloud providers would push cloud providers to offer near identical performance at near identical prices. But as we’ll find later in this article that is simply not the case.
Fig.1: Big Buckets of Cloud Provider Costs
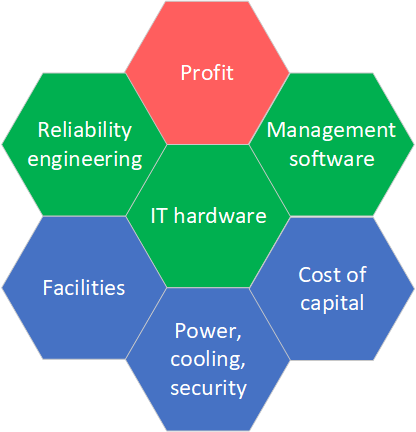
Fig. 1 shows the major cost buckets associated with running a public cloud service. As a user my interest is highlighted by the green hexagons - when the cloud provider invests in IT hardware, reliability engineering, and better management software. The cloud provider wants to maximize profit and reduce the cost of capital (e.g. by amortizing hardware and software costs over a longer period). Clearly the user’s benefit is not fully aligned with the cloud provider’s bottomline.
Since no public cloud provider was going to give me a breakup of how much they spend on each hexagon, I decided to compare single vCPU VM offerings of a few well known cloud providers - AWS, Google Compute Engine, Linode, and Azure - in order to get an idea of where my money goes when I buy VMs from them. I analyzed their performance against standard, repeatable and transparent tests and then normalized the measured performance with the retail per-hour cost of these VMs.
Before I begin, I should also state that harder-to-quantify benefits, such as reliability and intuitive/feature-rich management interface software (such as GUIs/APIs etc.) are also vital, although it is hard to measure and compare those features objectively. My thinking is that these features are now table stakes in the great public cloud computing games, and any public cloud provider would soon be out of business if they came up consistently short on these fronts.
The Contestants
Meet our VM contestants (prices shown are current as of April 2018):
| Provider/VM type | Notable specs | $USD/hour | Notes & Links |
|---|---|---|---|
| Google GCP/n1.standard.1 | 1 vCPU, 3.7GB RAM | $0.048 | Pricing; us-east1-b |
| Linode 2GB | 1 vCPU, 2 GB RAM | $0.015 | Pricing; Newark, NJ, USA |
| Amazon AWS t2.small | 1 vCPU, 2GB RAM | $0.073 | Pricing; unlimited burst; us-east-1 |
| Amazon AWS m3.medium | 1 vCPU, 3.75 GB RAM | $0.067 | Legacy generation; us-east-1 |
| MS Azure Standard F1s | 1 vCPU, 2 GB RAM | $0.05 | Pricing; US East |
These VMs were chosen because they have a single vCPU and have similar specs. The astute reader may notice the difference in RAM-size, this is simply because a T-shirt size with the same amount of RAM is not available across all the providers. I know I have left out plenty of capable cloud providers here. I intend to expand my test bench to include more cloud providers in the coming months (IBM, Oracle, Rackspace, Digital Ocean, Alibaba, etc. ); if you are a cloud provider then feel free to reach out to discuss how we can accelerate this.
My first thought was that these VMs should perform similarly; their descriptions are so similar. I knew there are noisy neighbor and shared infrastructure variables in public cloud but I hoped that after statistical averaging the measured vCPU performance would be roughly the same, at least when I normalized with respect to the cost. This would be a reassuring result, because I have seen many IT decision makers assume that similar VM specs across cloud providers are roughly equivalent. But are they really comparing apples-to-apples when the compare the similar “looking” VMs, such as the ones in the table above?
Test Methodology
I chose a fairly well known linux stress testing tool called stress-ng to run a series of tests on the VMs. The tool provides 100s of different tests to exercise the CPU, memory, caches, IO etc. These tests work by performing a specific sequence of operations to create a result and then measuring the rate (e.g. computing a square root of 1000 floating point numbers). My approach was to choose a small subset of the tests, and for each test record the number of times the operation could be repeated in a fixed time duration. From here I was able to get the rate of performing the operation(s) (e.g. VM was able to do 450,000 square root operations in 60 seconds, so the rate was 7500 operations/second).
From the cost-per-hour price of each VM and the number of operations the VM performed per second I was able to determine the number of operations that class of VMs can perform per dollar spent by the user. This metric (operations per dollar) lets us compare VMs intuitively in terms of how far a user’s spent dollar goes.
While these tests are certainly not representative of a real-world workload they are useful in comparing the raw CPU, memory and boot-disk IO subsystems. The tests saturate the subsystem being tested, and because each class of tests has 100s of variations (for example, see the list of CPU operations performed during my invocation of stress-ng, here, different part of the subsystems are throughly exercised. All the stress methods listed under “cpu-methods” are exercised sequentially in my test runs.)
The most important characteristic of the stress-ng tests is that they are exactly repeated on all the tested VMs. I have included a link to the test files on Github. All tested VMs use the most recent (April 2018) official Ubuntu 16.04 LTS operating system; by official I mean that the OS image used in the specific cloud is provided either by Canonical (the company behind Ubuntu) or the cloud provider itself. I noticed minor variations in the kernel version, but I am reasonably certain this is not a significant difference for the purpose of the tests here.
I average the results over 8 identically created VMs in the analysis presented below. These VMs are spun up in a specific zone/cloud provider data center; I intend to investigate multi-data center performance statistics in subsequent articles.
The test setup is automated using Salt. I will be publishing another article detailing how the tests are setup and automated in the coming weeks. My hope is that going forward some of the experts in systems performance analysis will start contributing test cases via pull requests on Github to make these investigations more accurate and noteworthy. If you are interested in participating in these sorts of analyses in the future please reach out to me. I also have detailed collectd system performance metrics and all the raw data from the VMs/tests discussed here; I am happy to share that data with subject matter experts and stakeholders should there be interest.
Notable Results
I will start with CPU operations. The bar graphs of Fig.2 show the CPU operations performed per second and per dollar spent. In order to compute the number of CPU operations per dollar spent I multiplied the CPU operations performed per second by 3600 (the number of seconds in 1 hour) and then divided that quantity by the cost of running the VM for 1 hour (Table 1). The bars indicate the average across 8 VMs; error bars are marked.
Fig.2: CPU operations
Stress-ng cpu documentation |
Tested VM sizes and costs |
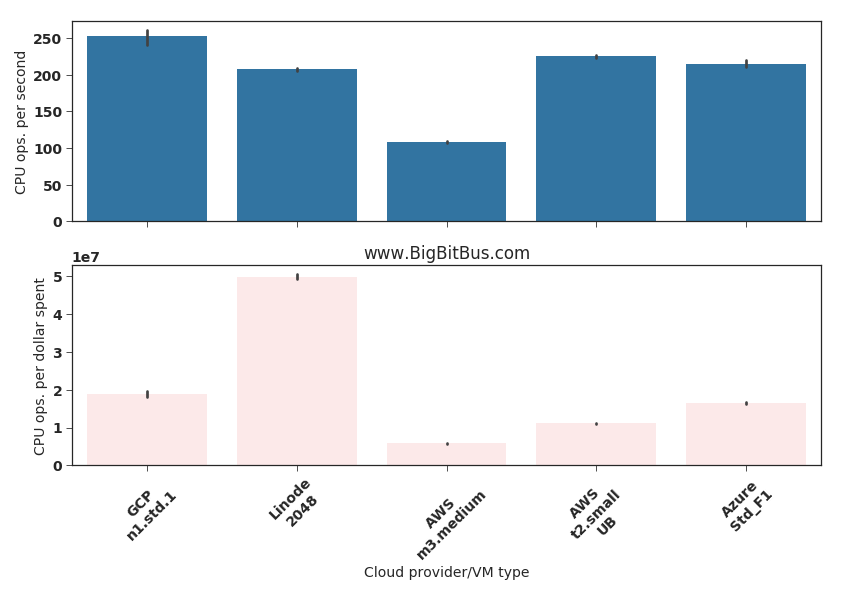
The bar graphs indicate similar performance across all VM types, except the AWS m3.medium VM. AWS documentation clearly mentions that the m3.medium VM is “legacy”. I checked the /proc/cpuinfo information on a m3.medium VM and sure enough it is powered by a 5 year old Intel Xeon CPU E5-2670 v2 CPU compared to the more recent and custom-built-for-AWS Intel Xeon CPU E5-2676 v3 used in the AWS t2.small machines:
CPU information from an AWS m3.medium VM showing the Intel Xeon V2 CPU
processor	: 0
vendor_id	: GenuineIntel
cpu family	: 6
model		: 62
model name	: Intel(R) Xeon(R) CPU E5-2670 v2 @ 2.50GHz
stepping	: 4
microcode	: 0x42a
cpu MHz		: 2494.036
cache size	: 25600 KB
...
flags		: fpu vme de pse tsc msr pae mce cx8 apic sep mtrr pge mca cmov pat pse36 clflush mmx fxsr sse sse2 ht syscall nx rdtscp lm constant_tsc rep_good nopl xtopology eagerfpu pni pclmulqdq ssse3 cx16 pcid sse4_1 sse4_2 x2apic popcnt tsc_deadline_timer aes xsave avx f16c rdrand hypervisor lahf_lm retpoline kaiser fsgsbase smep erms xsaveopt
bugs		: cpu_meltdown spectre_v1 spectre_v2
bogomips	: 4988.07
...
Comparing this to the more modern AWS t2.small Xeon V3 CPU
processor	: 0
vendor_id	: GenuineIntel
cpu family	: 6
model		: 63
model name	: Intel(R) Xeon(R) CPU E5-2676 v3 @ 2.40GHz
stepping	: 2
microcode	: 0x3c
cpu MHz		: 2400.076
cache size	: 30720 KB
...
flags		: fpu vme de pse tsc msr pae mce cx8 apic sep mtrr pge mca cmov pat pse36 clflush mmx fxsr sse sse2 ht syscall nx rdtscp lm constant_tsc rep_good nopl xtopology eagerfpu pni pclmulqdq ssse3 fma cx16 pcid sse4_1 sse4_2 x2apic movbe popcnt tsc_deadline_timer aes xsave avx f16c rdrand hypervisor lahf_lm abm invpcid_single retpoline kaiser fsgsbase bmi1 avx2 smep bmi2 erms invpcid xsaveopt
bugs		: cpu_meltdown spectre_v1 spectre_v2
bogomips	: 4800.15
...
The AWS m3.medium discussion is a great example of cloud providers trying to reduce capital cost by offering VMs on older hardware (at almost the same price as the newer generation AWS t2.small VM!). I suspect that this issue of users ending up on old and less performant hardware will become quite common as cloud providers look for higher profits. Perhaps a more innovative pricing model from cloud providers that takes relative performance into account is needed to bring out more fairness for uninformed users. Until then, users should be vigilant that their VMs don’t land on old hardware.
Linode wins hands down on the performance-to-cost ratio. Their VM’s cost/hour is less than a third of their next lowest priced competitor. So while their VM is not the most performant, they provide the most bang for the buck by far.
Fig.3: Memory malloc operations
Stress-ng malloc tests documentation |
Tested VM sizes and costs |
Read about Malloc
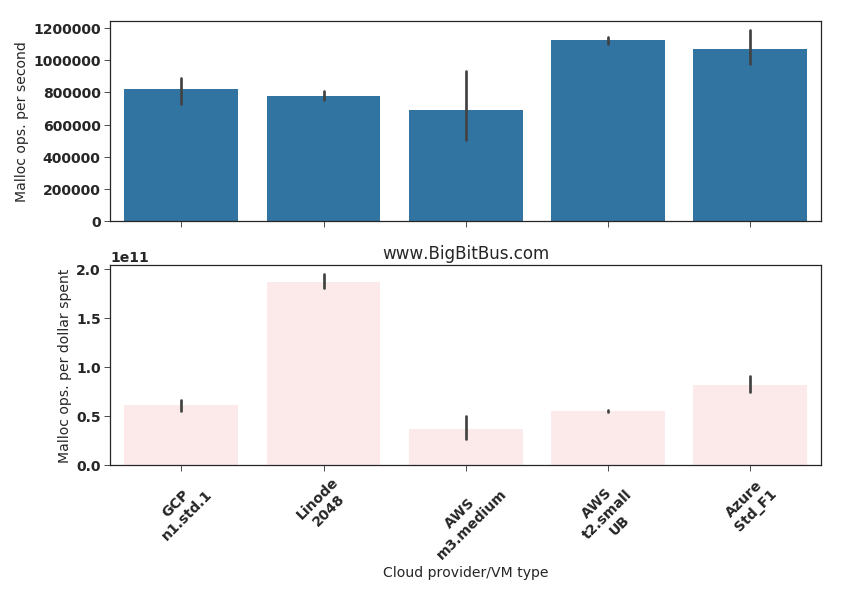
The malloc tests exercise the allocation and freeing up of memory on the VM. From the stress-ng documentation
--malloc N
              start  N  workers  continuously  calling  malloc(3),  calloc(3),
              realloc(3)  and free(3). By default, up to 65536 allocations can
              be active at any  point,  but  this  can  be  altered  with  the
              --malloc-max  option.   Allocation, reallocation and freeing are
              chosen at random; 50% of the  time  memory  is  allocation  (via
              malloc,  calloc  or realloc) and 50% of the time allocations are
              free'd.  Allocation sizes are  also  random,  with  the  maximum
              allocation  size  controlled  by  the --malloc-bytes option, the
              default size being 64K.  The  worker  is  re-started  if  it  is
              killed by the out of mememory (OOM) killer.
Fig.3 shows that Google’s n1.standard.1 VM is significantly slower on this test compared to the AWS t2.small and the Azure Standard_F1 VMs. Why this is the case is not clear to me, perhaps a slower RAM architecture or something different in their hypervisor software stack.
Again. AWS m3.medium VMs are the worst and Linode VMs are the most value for money.
Fig.4: Boot disk mixed IO operations
Stress-ng mixed IO tests documentation |
Tested VM sizes and costs |
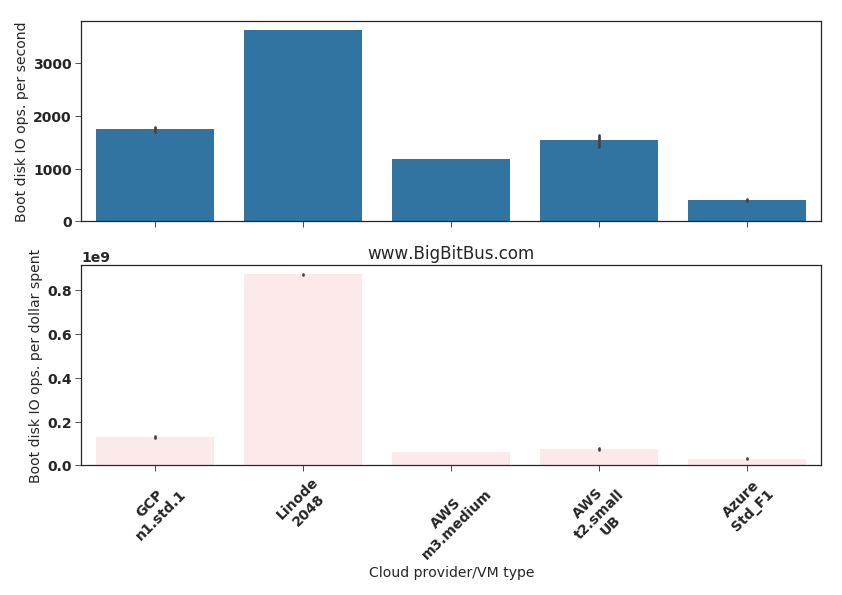
I included a “mixed IO” stress-ng test results (Fig.4) on the boot disk because this can impact reboot and process loading times (the same disk has the Linux root FS on these VMs). The Azure Standard_F1 VM’s boot disk was significantly slower than all the other contestants. Again its hard to discern why unless there is more transparency around the hypervisor and IO architecture.
The “matrix” operations test results shown in Fig. 5 are closer to a real-world scenario since they concurrently stress multiple subsystems. From the stress-ng documentation
 --matrix N
              start N  workers  that  perform  various  matrix  operations  on
              floating point values. Testing on 64 bit x86 hardware shows that
              this provides a good mix of memory,  cache  and  floating  point
              operations and is an excellent way to make a CPU run hot.

              By default, this will exercise all the matrix stress methods one
              by one.  One can specify a specific matrix  stress  method  with
              the --matrix-method option.
Fig.5: Matrix operations (cache,memory, CPU); higher is better
Stress-ng mixed IO tests documentation |
Tested VM sizes and costs |
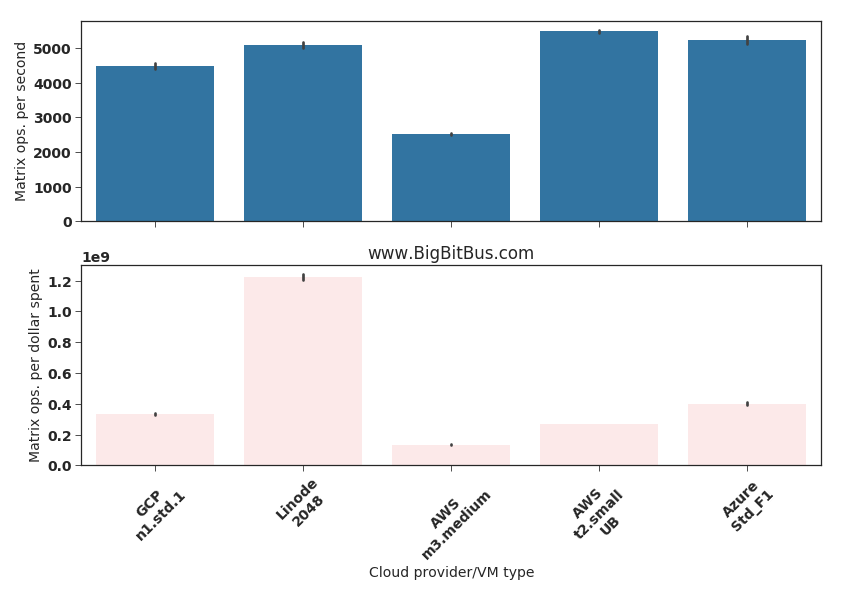
Again, the AWS m3.medium is the worst, Linode 2048 is the best (performance/cost wise), and the rest of the 3 contestants are within about 20% of each other performance-wise (a significant variation). The higher cost of the AWS t2.small unlimited VM makes it lag behind the Google and Microsoft offerings when it comes to how many such operations a dollar can buy.
Outlook
Similar 1-vCPU VMs of different cloud providers deliver very different performance-per-dollar. Cloud providers can arbitrarily adjust VM performance (think oversubscription and performance throttling), VM prices, and the underlying infrastructure. Since there is very little transparency on what the future capacity, upgrade and depreciation plans of cloud providers are, users are on the hook when it comes to maximizing the value of their cloud spend; they can win in this game by carefully tracking and updating their cloud devops and orchestration code to keep up with the cloud provider changes.
This also reinforces the importance of building cloud provider independent architectures and not overly depending on proprietary offerings (such as a cloud-provider-specific database implementation) - a user should try to keep the option to move to another cloud provider. There is no standardized performance agreement across cloud providers and nothing in the cloud provider SLA guarantees anything other than minimum performance. It may very well be worth switching cloud providers as their performance-to-cost ratios change over time.
I have only looked at a minuscule component -single vCPU VMs - of a few pubic cloud offerings. Stay tuned as we dig into multi-core VM types, container technologies, cloud storage and networking in the IaaS space, and go on to evaluate managed big-data and analytics services performance/cost in future articles in this series.
*
Sachin Agarwal is a computer systems researcher and the founder of BigBitBus.
BigBitBus is on a mission to bring greater transparency in public cloud and managed big data and analytics services.