We measured and compared object storage latency of standard and lower tier AWS S3, Google Cloud storage and Azure blob storage in order to unearth performance differences between the storage tiers.
This article is an extension to the article on comparing object store performance across AWS S3, Google cloud storage and Azure blob storage; you may want to read that article to get more context around the testing and methodology used for this extension.
AWS S3, Google Cloud Storage and Azure storage offer a “lower” tier for objects storing backups or archive data that are infrequently accessed. AWS S3 calls it standard infrequently accessed storage, Google cloud storage calls it near-line storage, and Azure calls it cool blob storage. Note we are not comparing Amazon Glacier in this article.
Results
We created different sized objects and measured creation, download, and deletion latencies for these objects; data presented here is averaged over 100 unique runs. We chose ca-central-1, northamerica-northeast1 and canadacentral regions for AWS, Google cloud and Azure respectively.
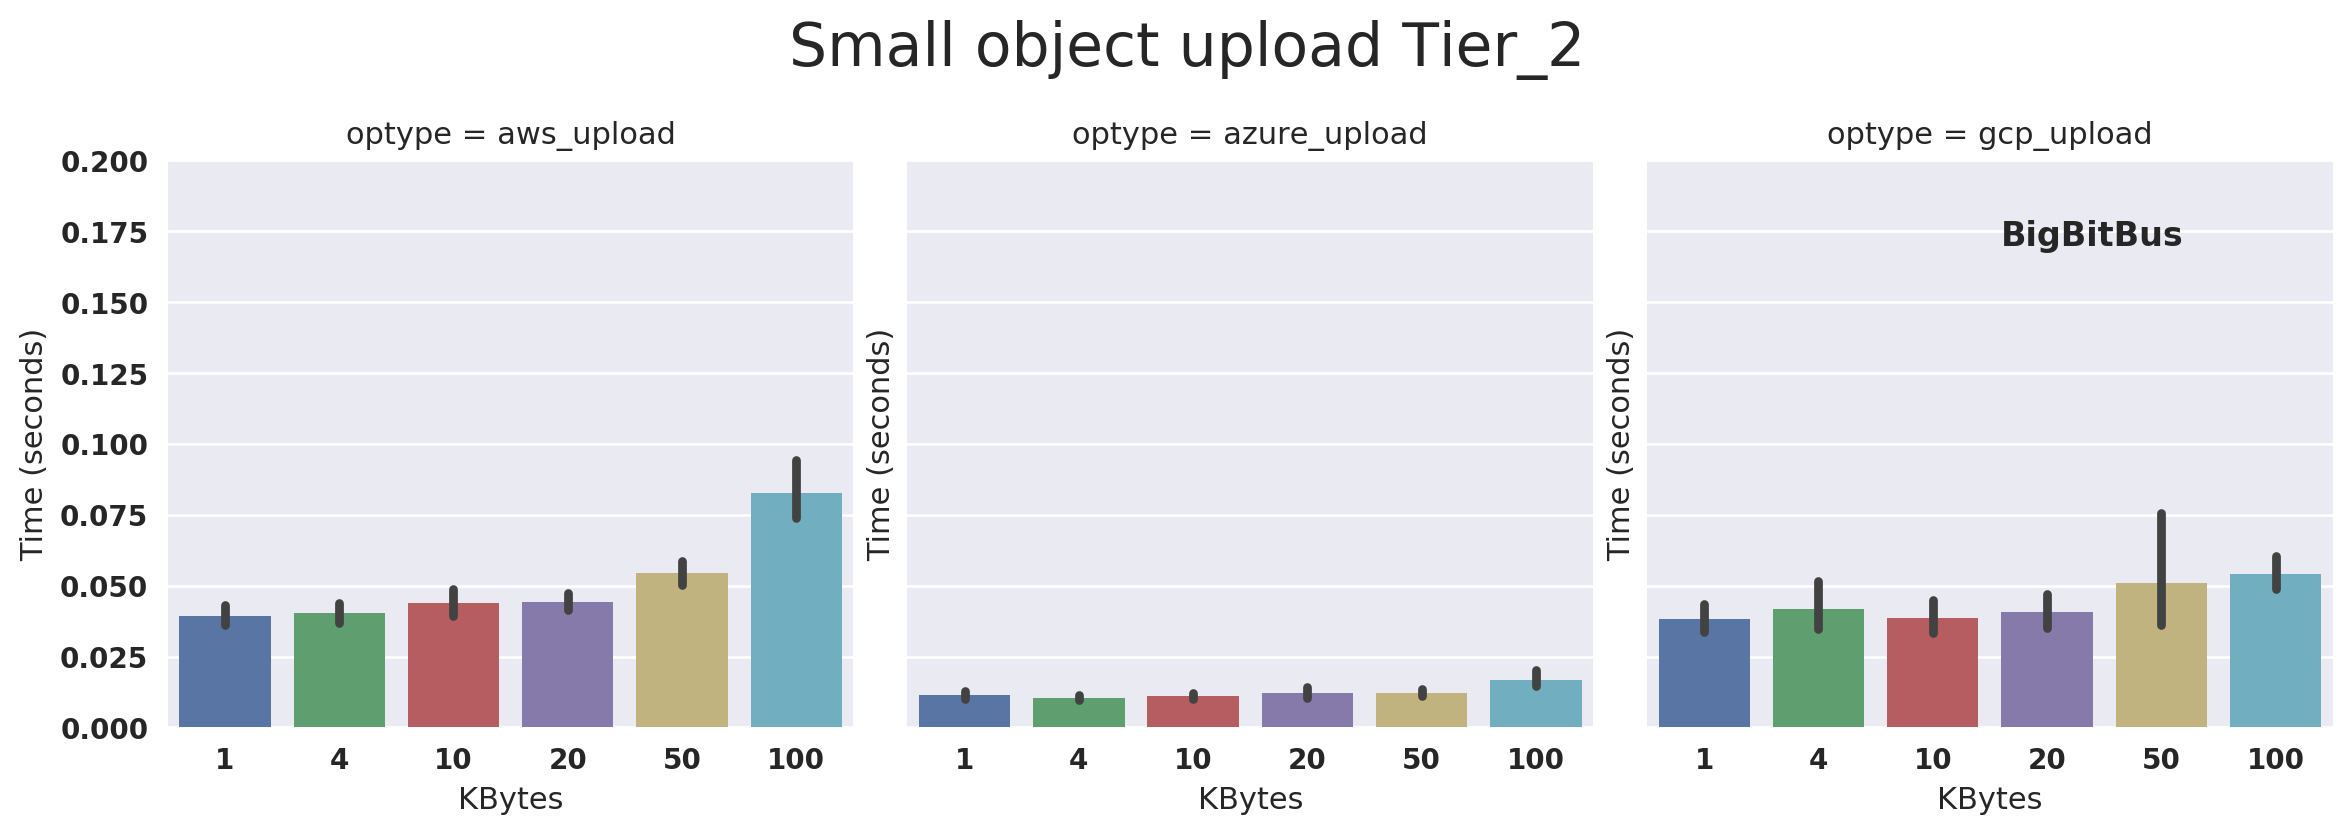
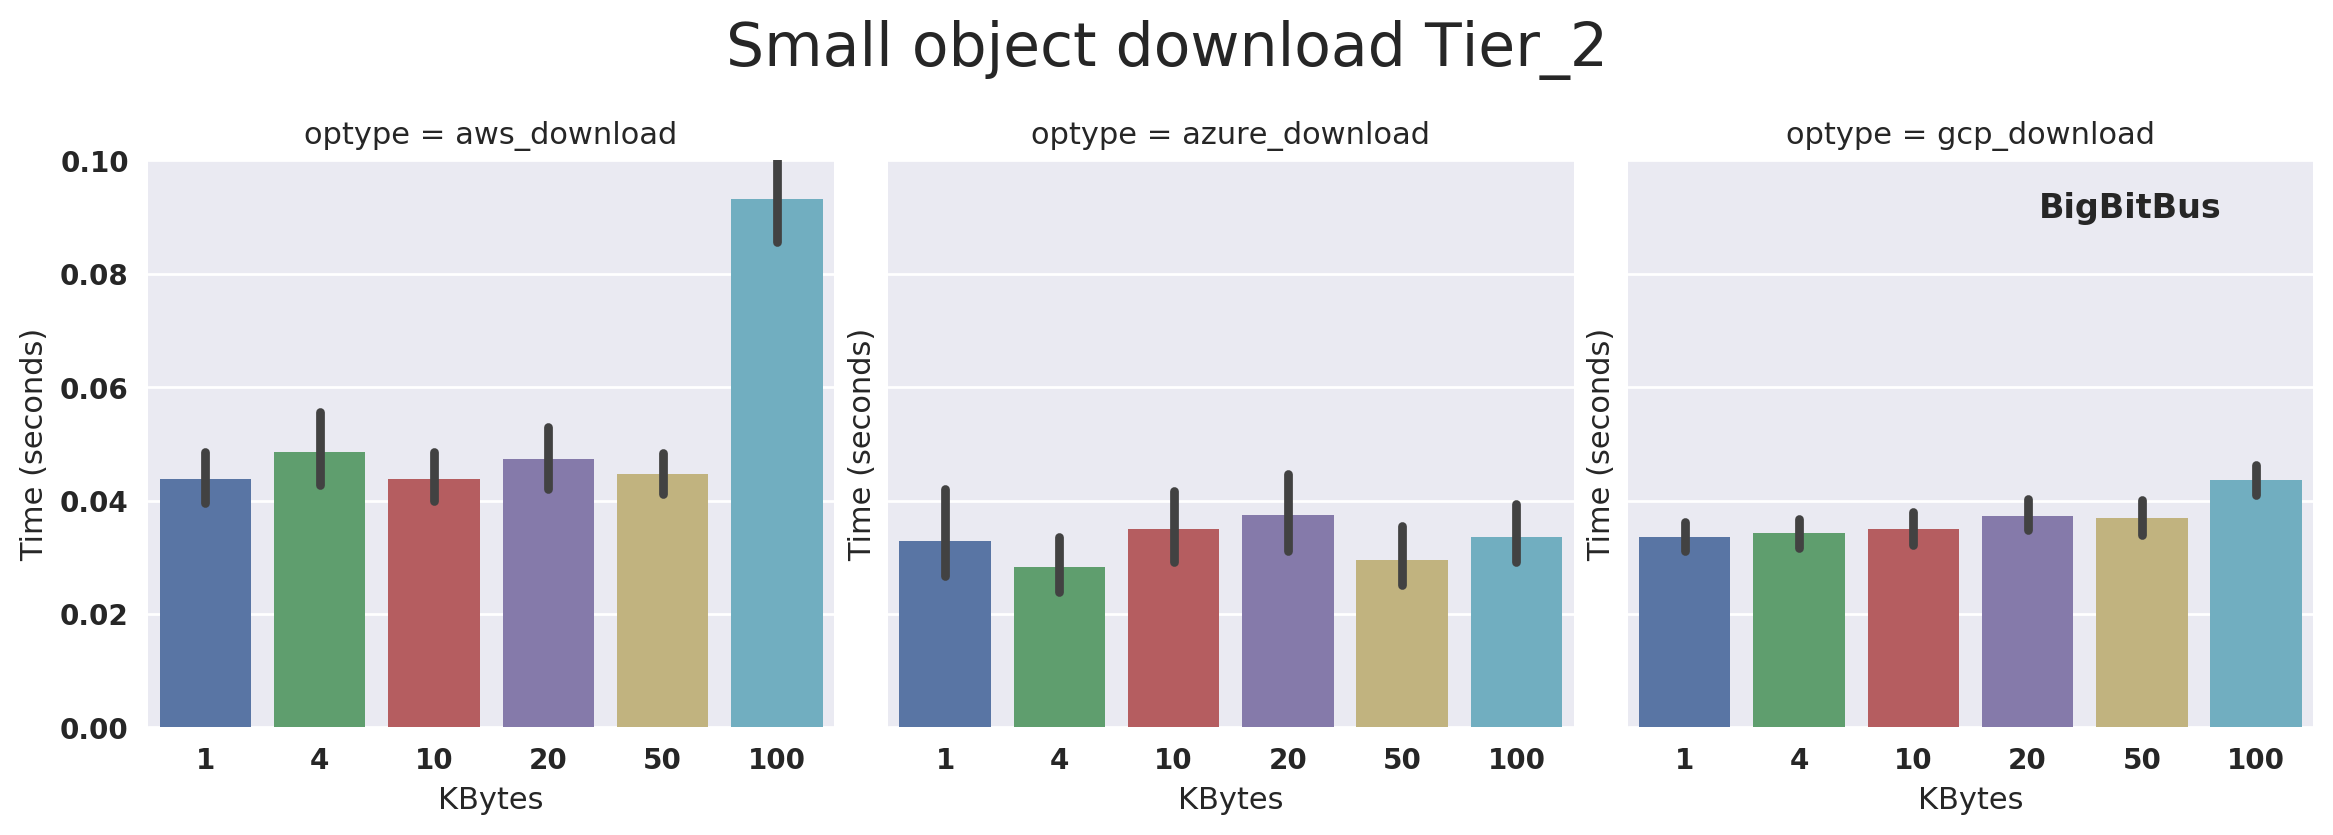
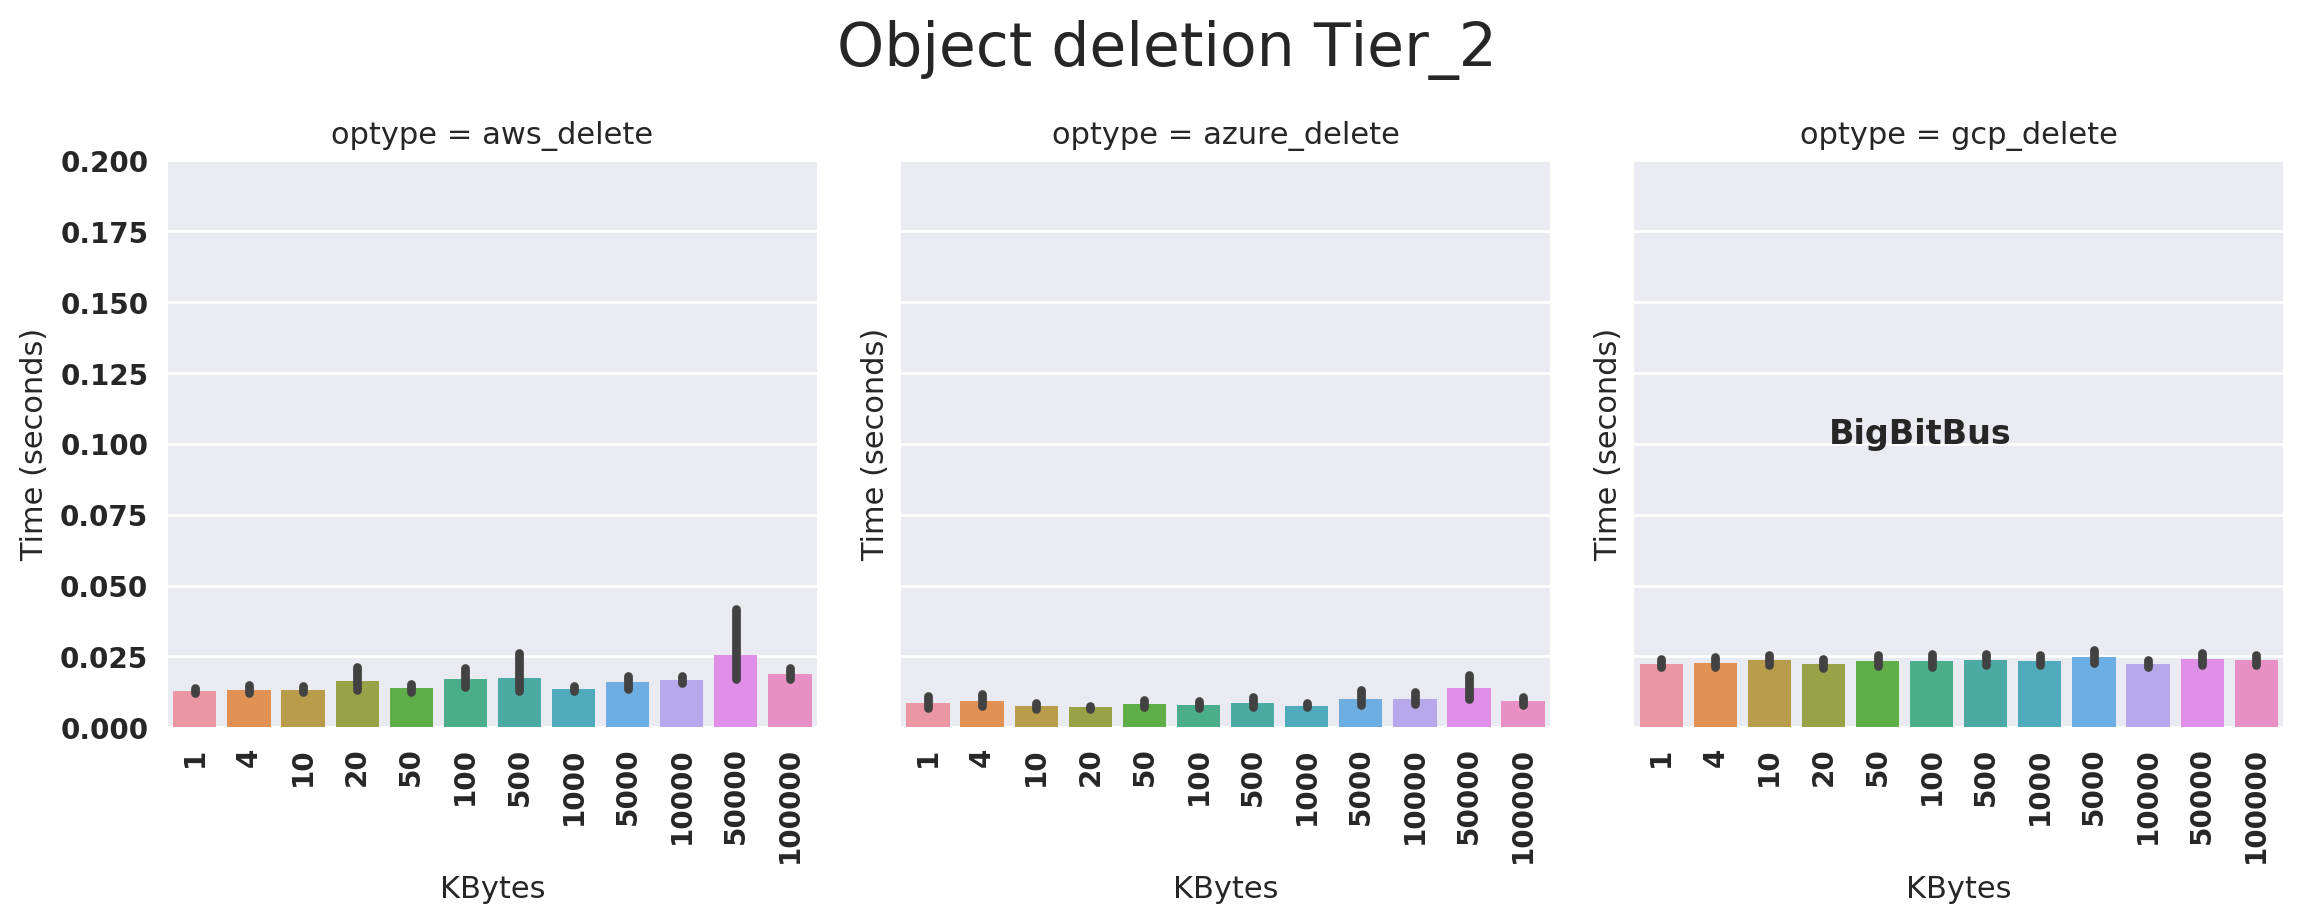
We present 5 pairs of Figures below; each figure has 3 bar plots in it that show the latency of the corresponding object store operation on the AWS, Azure and GCP providers. The two figures in the pair correspond to the higher tier (Tier 1 - standard object-store tier) and the lower tier (Tier 2) - infrequent access, cool blobs and near-line storage for AWS, Azure and GCP respectively.
The key take-away from each pair is that the latency statistics for Tier 1 and Tier 2 objects are almost identical!
Small object sizes upload
Fig.1a: Higher tier small objects (up to 100kB) upload latency in Canada
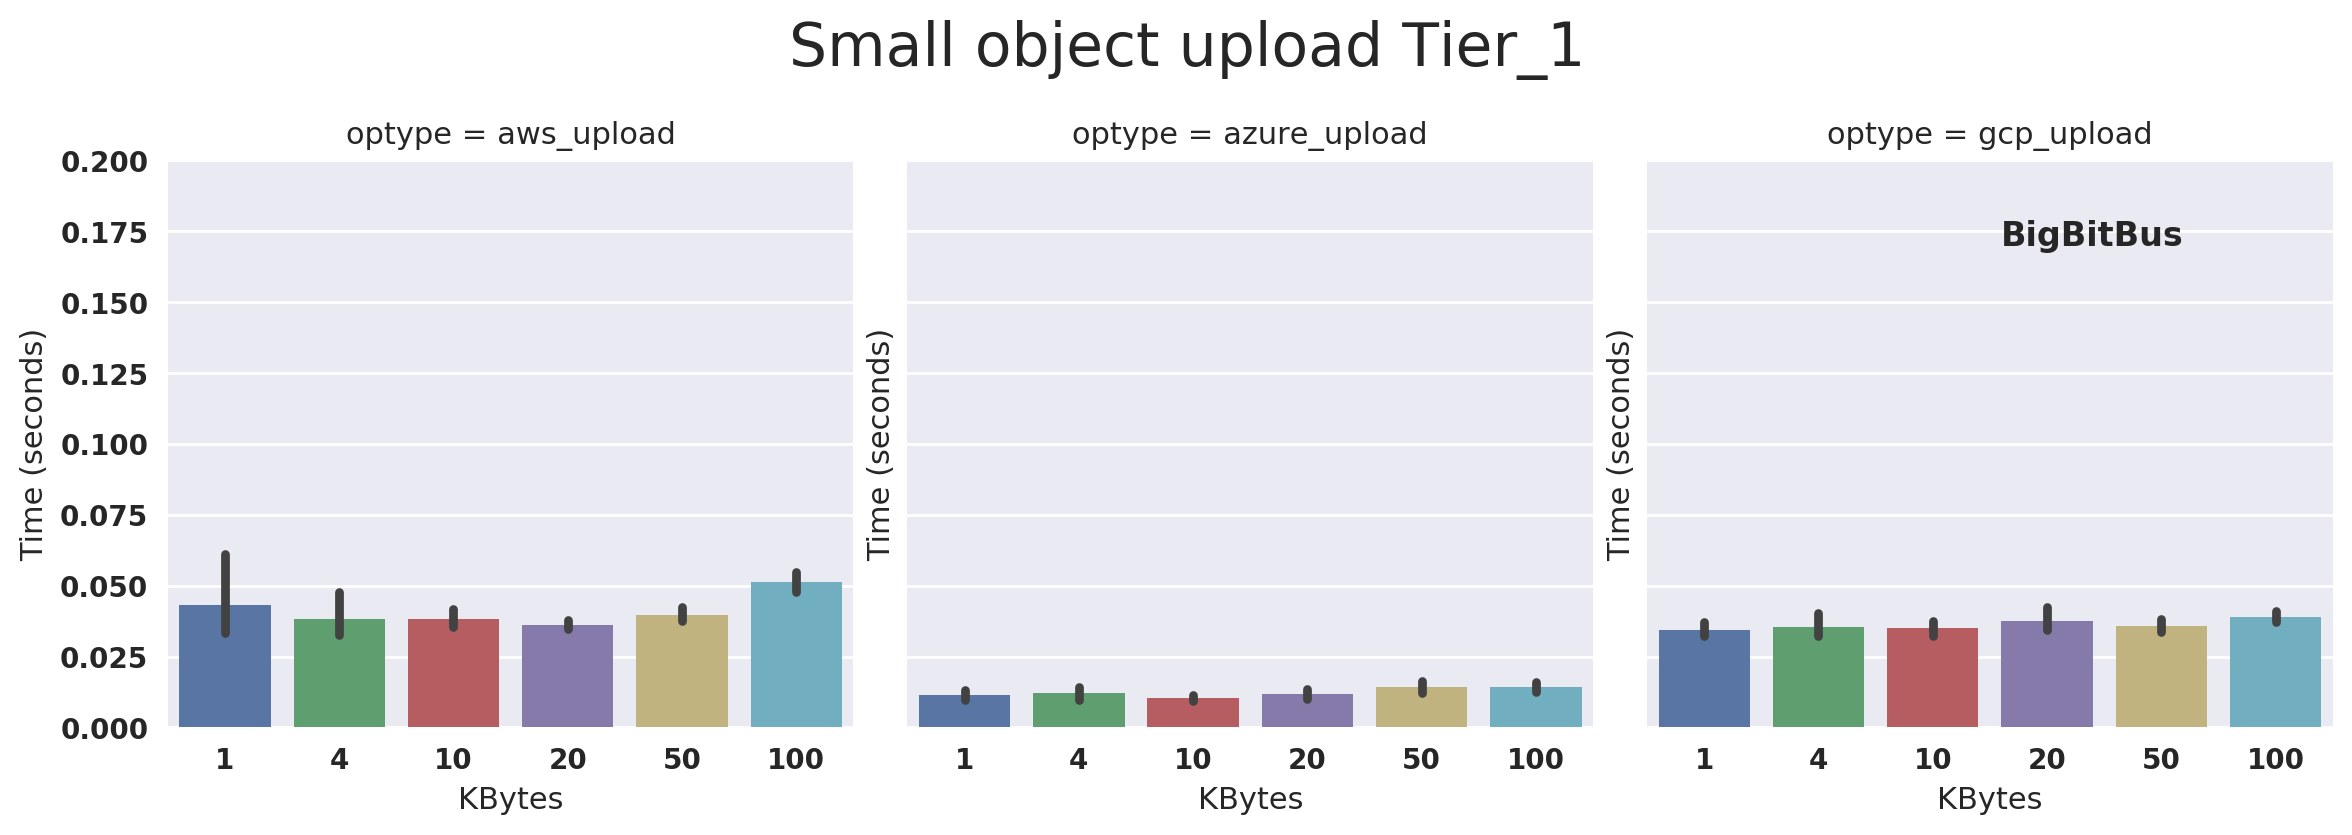
Fig.1b: Lower tier small objects (up to 100kB) upload latency in Canada
Small object sizes download
Fig.2a: Higher tier small objects (up to 100kB) download latency in Canada
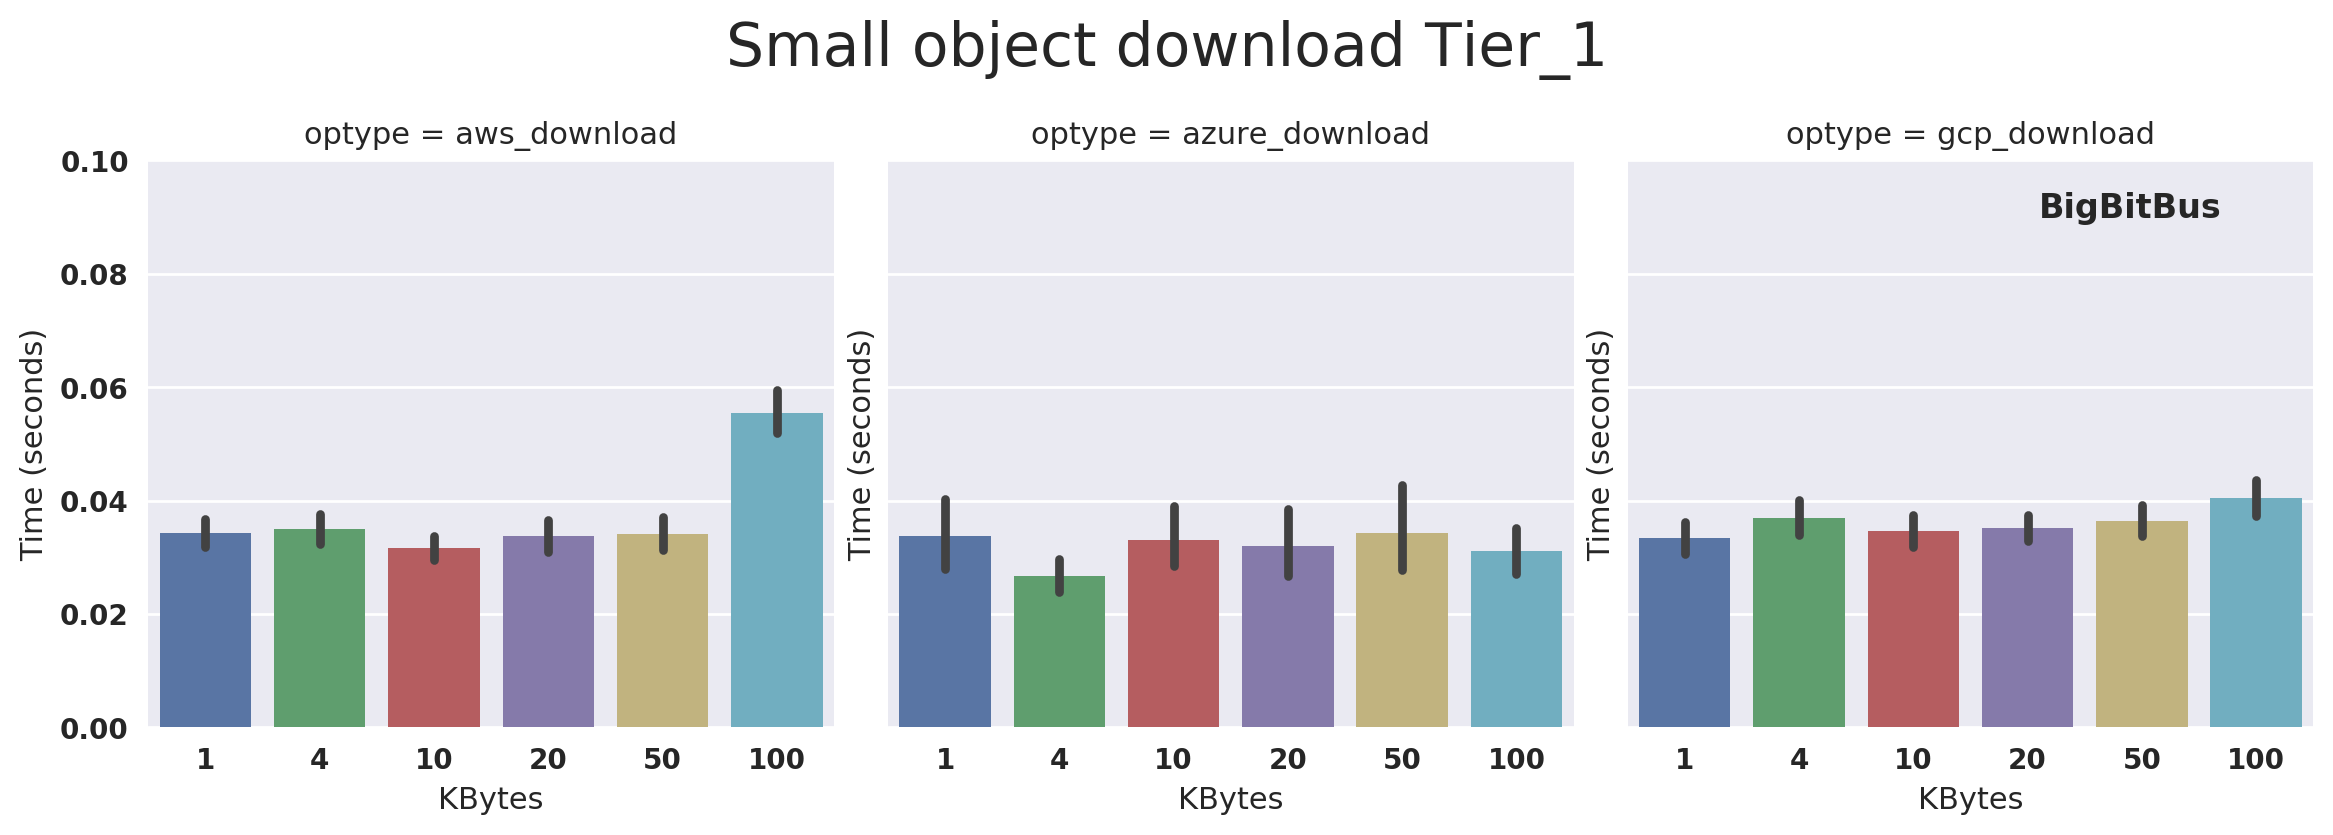
Fig.2b: Lower tier small objects (up to 100kB) download latency in Canada
Large object sizes upload
Fig.3a: Higher tier large objects (1MB - 100MB) upload latency in Canada
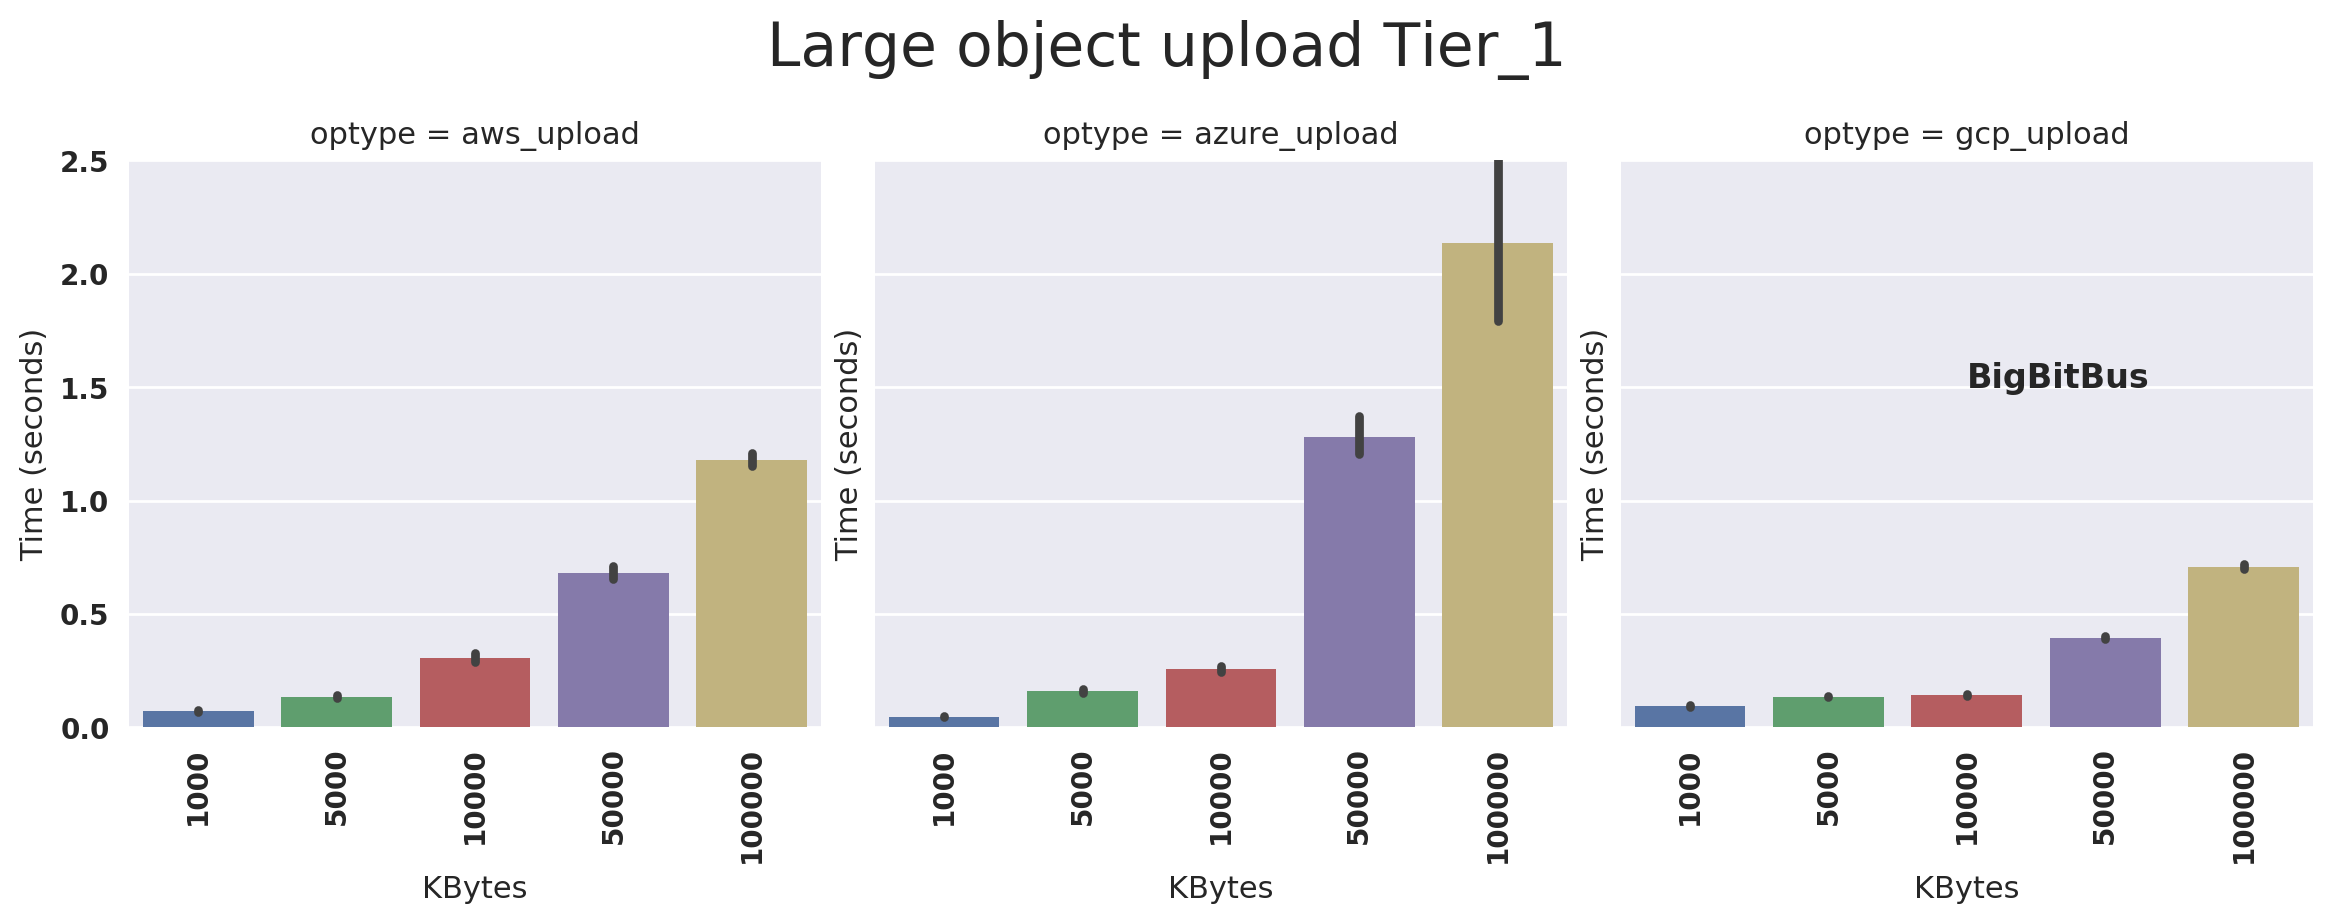
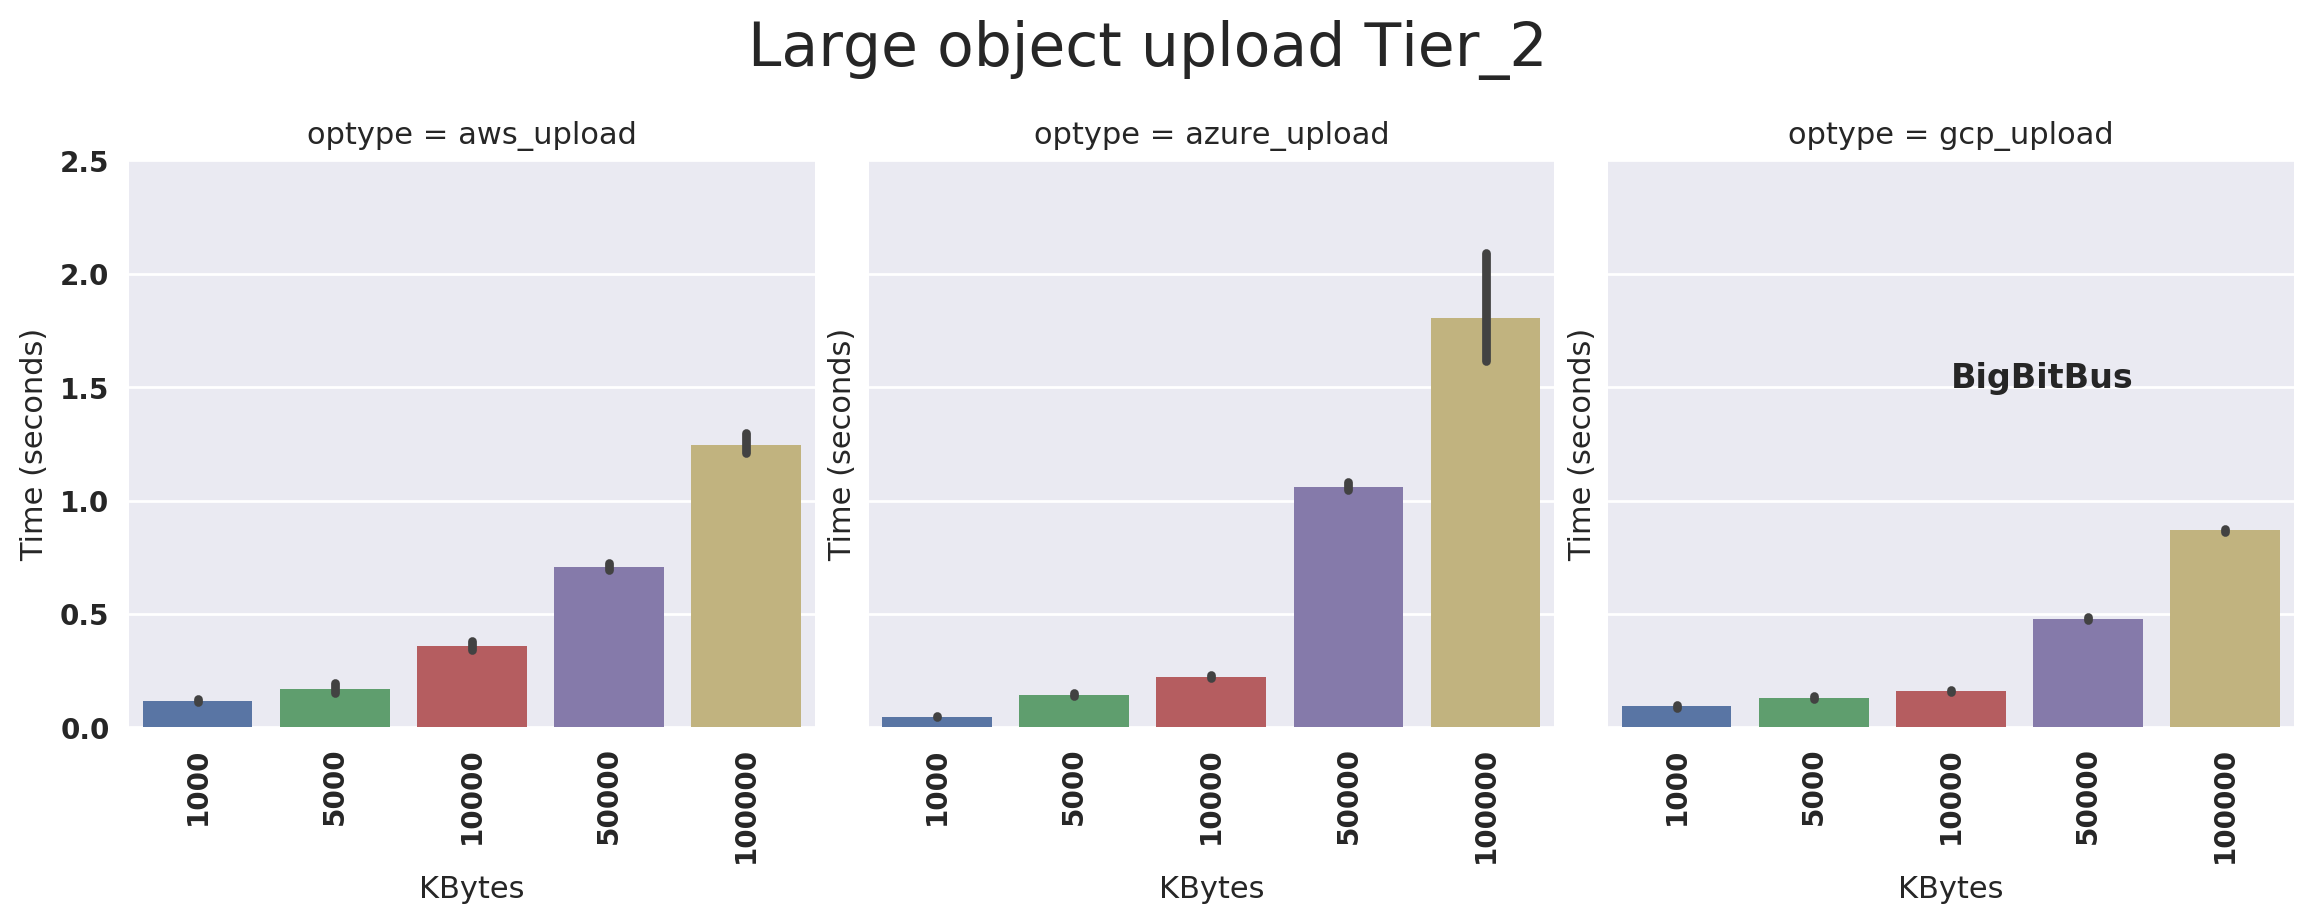
Fig.3b: Lower tier large objects (1MB - 100MB) upload latency in Canada
Large object sizes download
Fig.4a: Higher tier large objects (1MB - 100MB) download latency in Canada
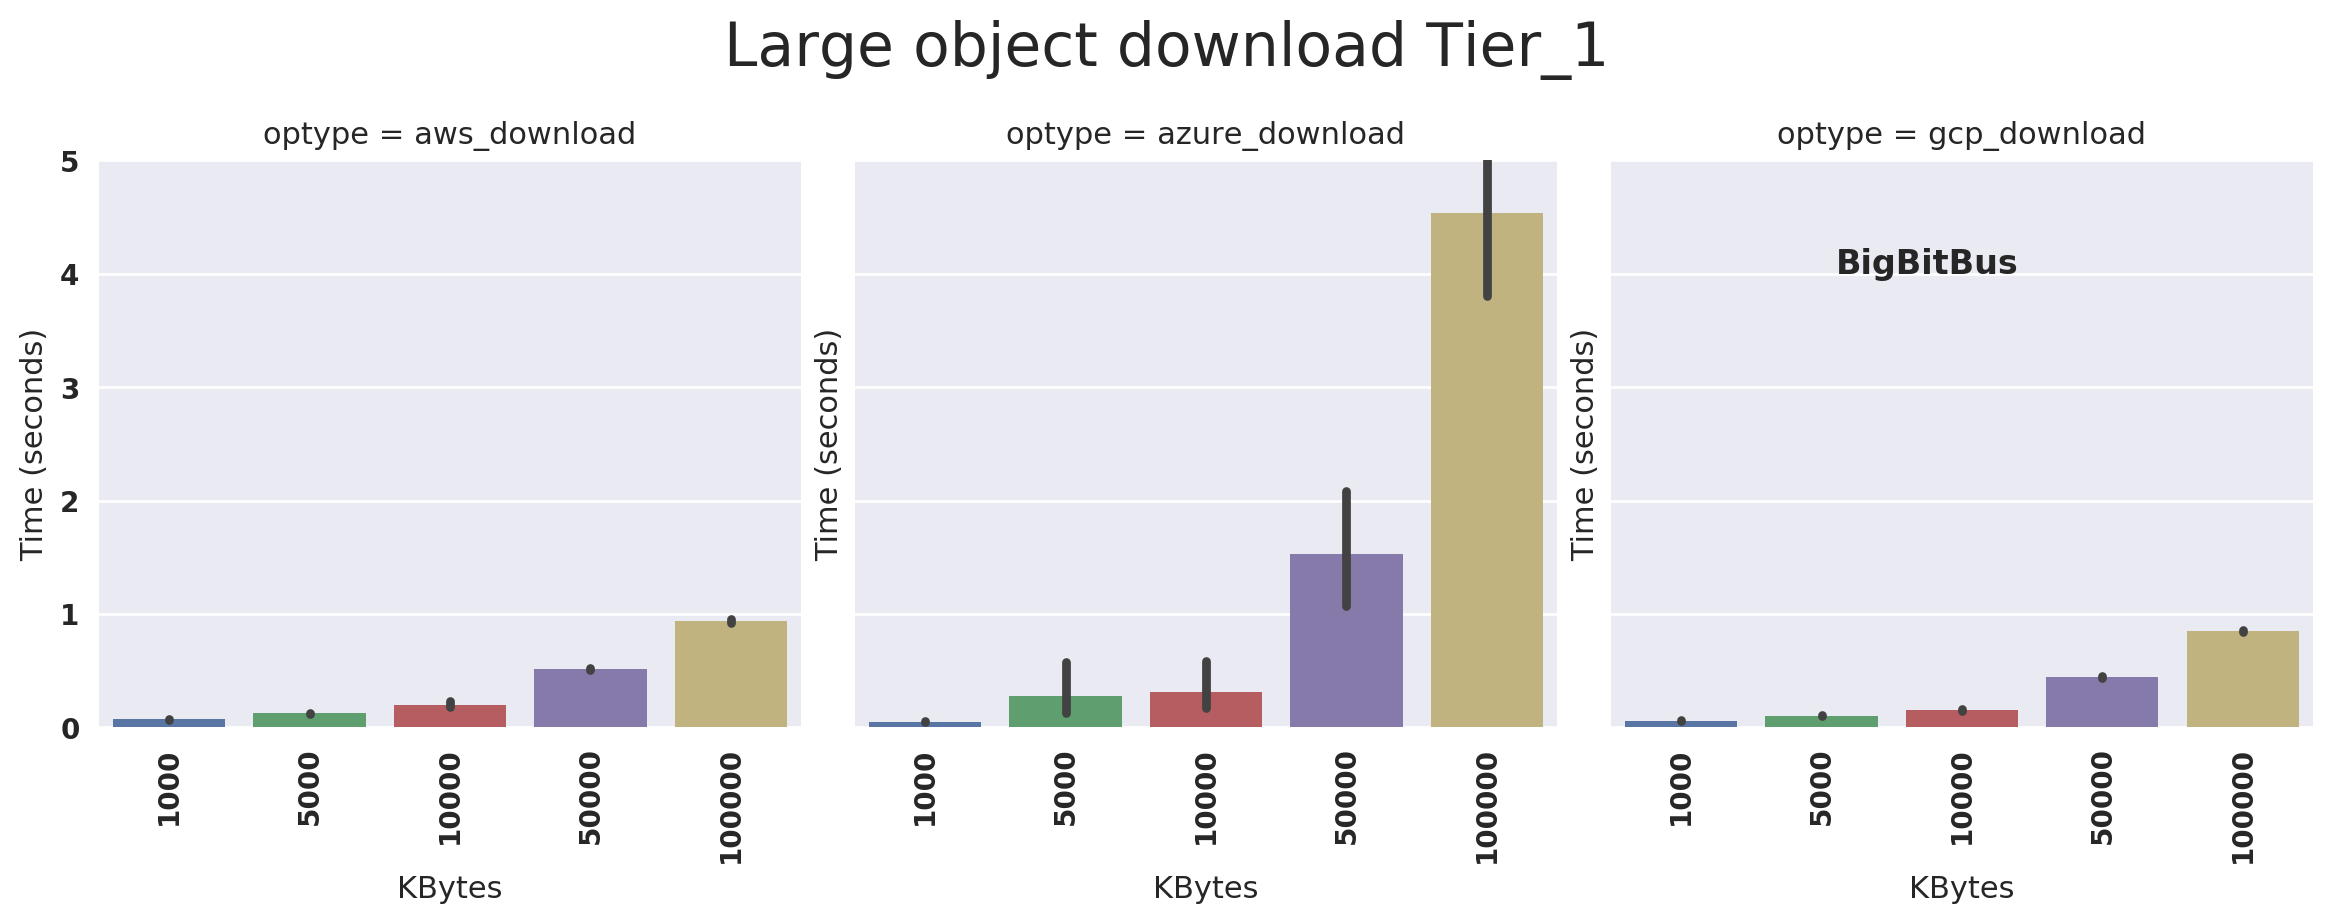
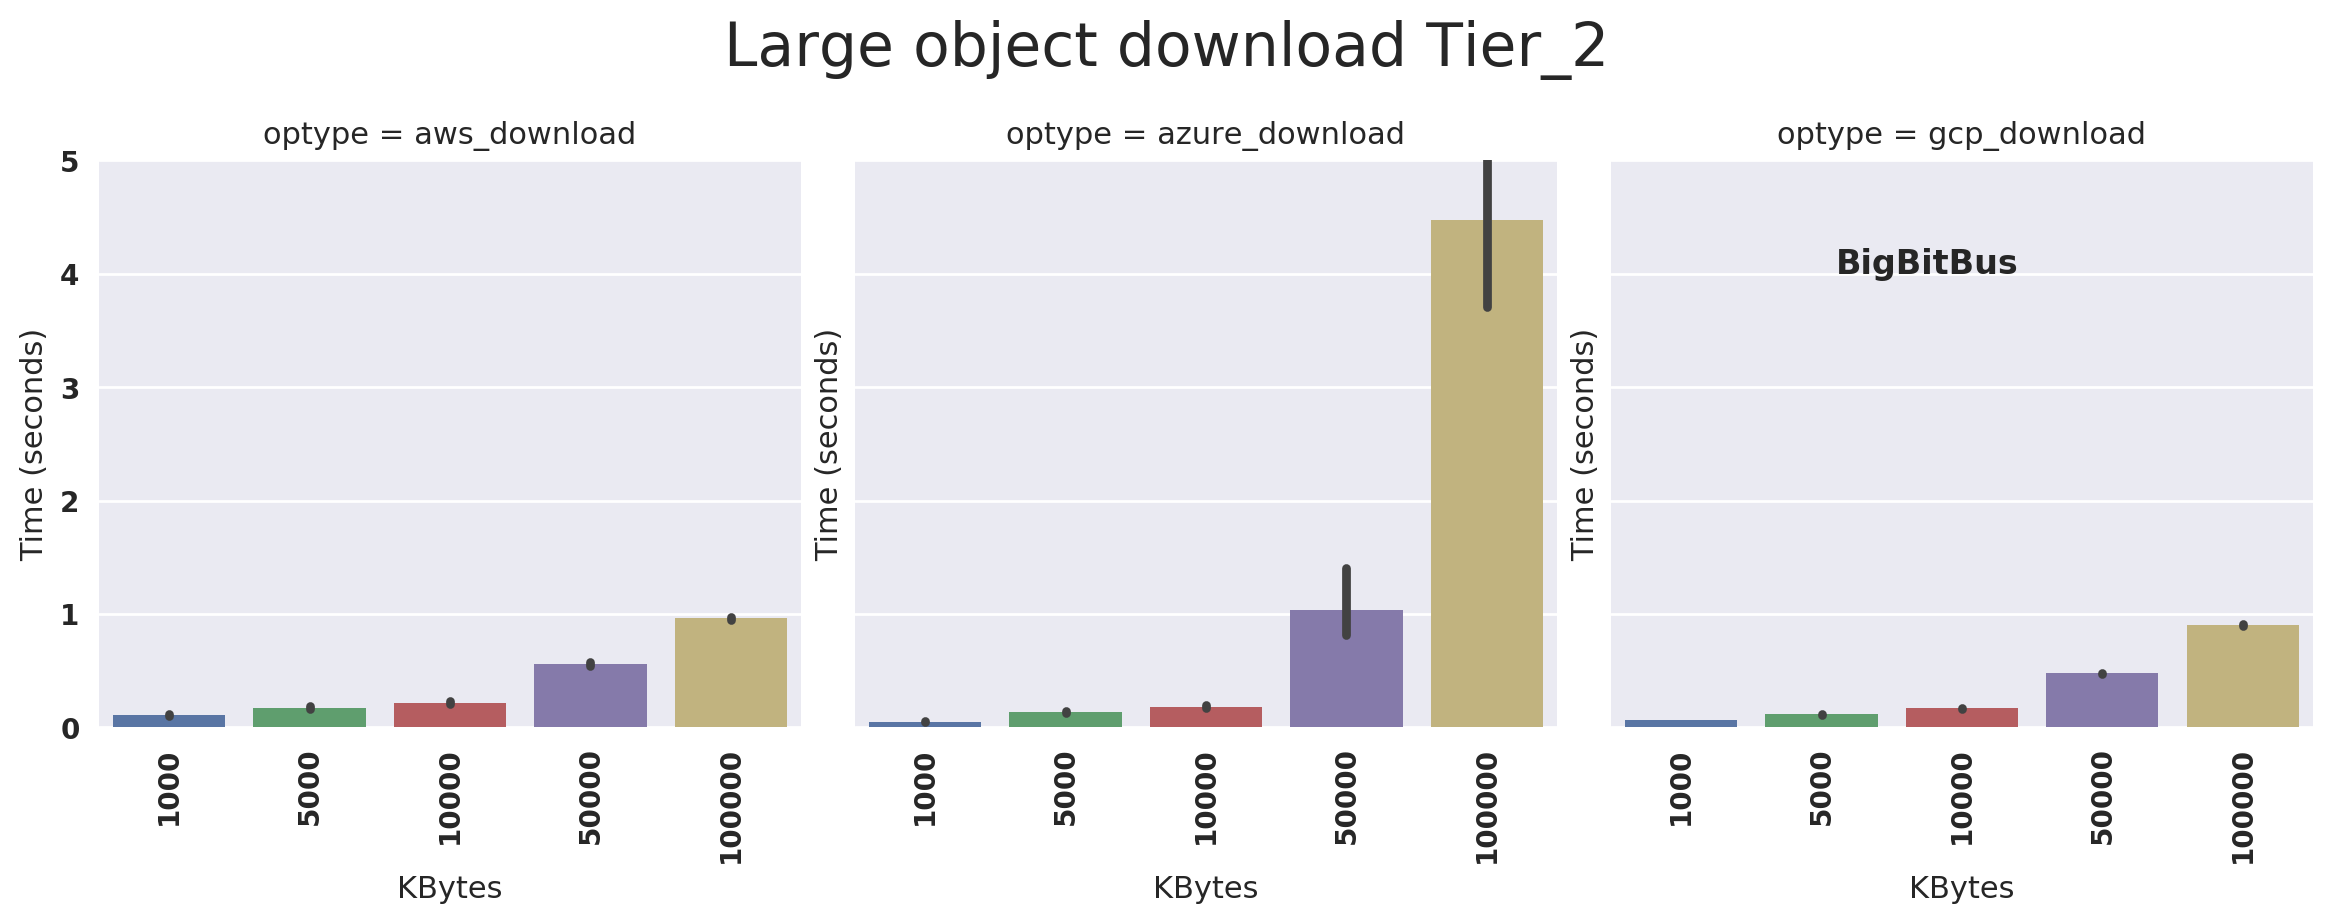
Fig.4b: Lower tier large objects (1MB - 100MB) download latency in Canada
Object Deletion
Fig.5a: Higher tier object deletion latency in Canada
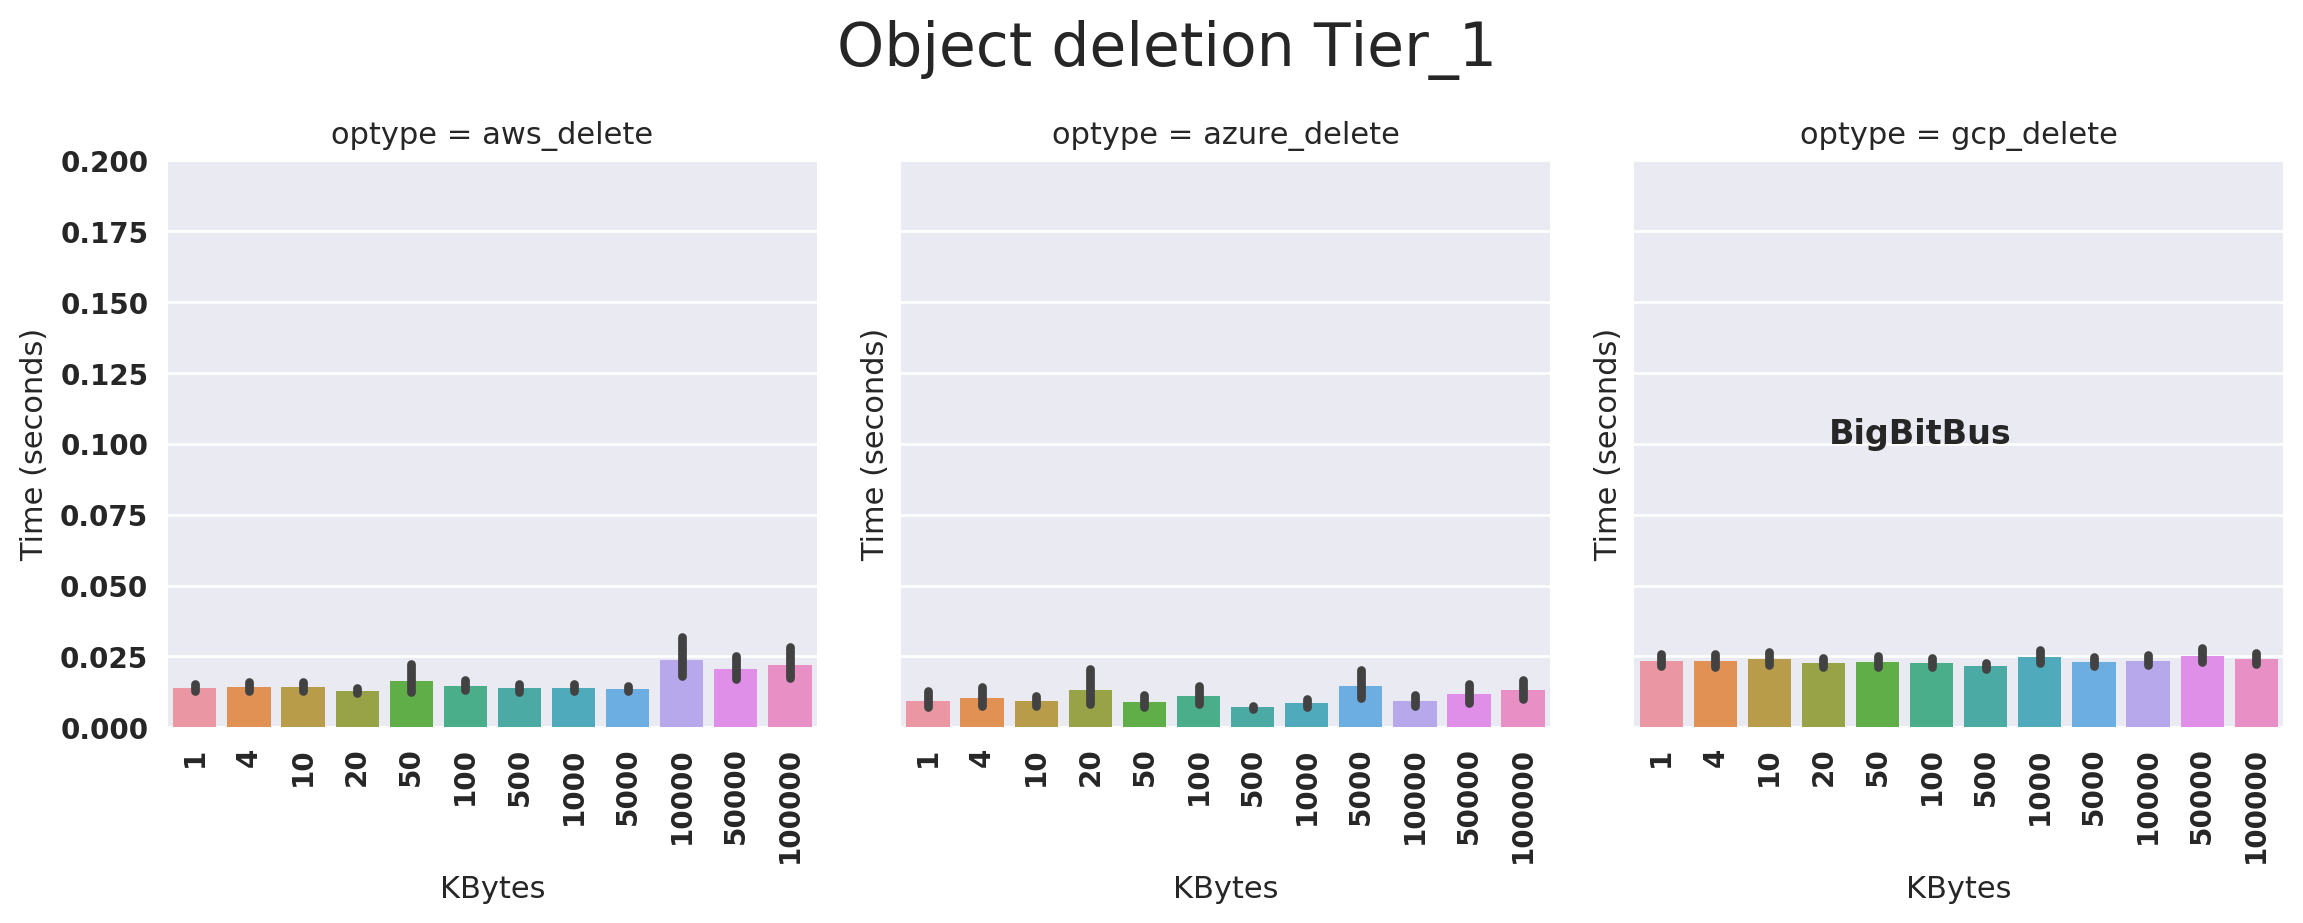
Fig.5b: Lower tier object deletion latency in Canada
Outlook
The upload, download and deletion latencies of lower tier objects are almost identical to the tier-1 object store for all three cloud providers. Since the differences are not statistically significant; we believe that the difference is purely in product pricing and positioning and that the underlying object-store implementation of Tier 1 and Tier 2 object-stores is shared.
If that is true, then we ask, why don’t cloud providers simply adjust users’ billing based on which tier each user object fell in during each billing period in order to minimize the user’s cost, instead of making the user juggle objects to try and optimize each object’s tier? For example, charge infrequently accessed user objects at tier 2 prices and hotter tier objects at tier 1 prices to minimize the user’s cost automatically. Free the overworked storage admins and developers from this menial task!
Sachin Agarwal is a computer systems researcher and the founder of BigBitBus.
BigBitBus is on a mission to bring greater transparency in public cloud and managed big data and analytics services.